 Colorado Migration
Summary
The vast majority of people moving to Colorado are from California.
This is followed by people moving in from Illinois and New York.
These states are mostly sending Colorado Unaffiliated voters.
It does appear that Coloradans are more apt to leave CO for reliably red states.
Registration has grown by about twice the number of people who have moved into Colorado.
Net migration to Colorado has slowed down in the past two years.
The Numbers
The Colorado legislature has passed legislation binding Colorado to the national popular vote and Gov. Polis has declared his intention to sign it. Outrage over this has brought out some old refrains — “Those Californians ruined their state and now they want to ruin ours” and the opposing “That’s it, those Californians have ruined my state. I’m moving.” So, I decided to hit the census data and see… Just how true are those two statements?
Colorado Migration by State
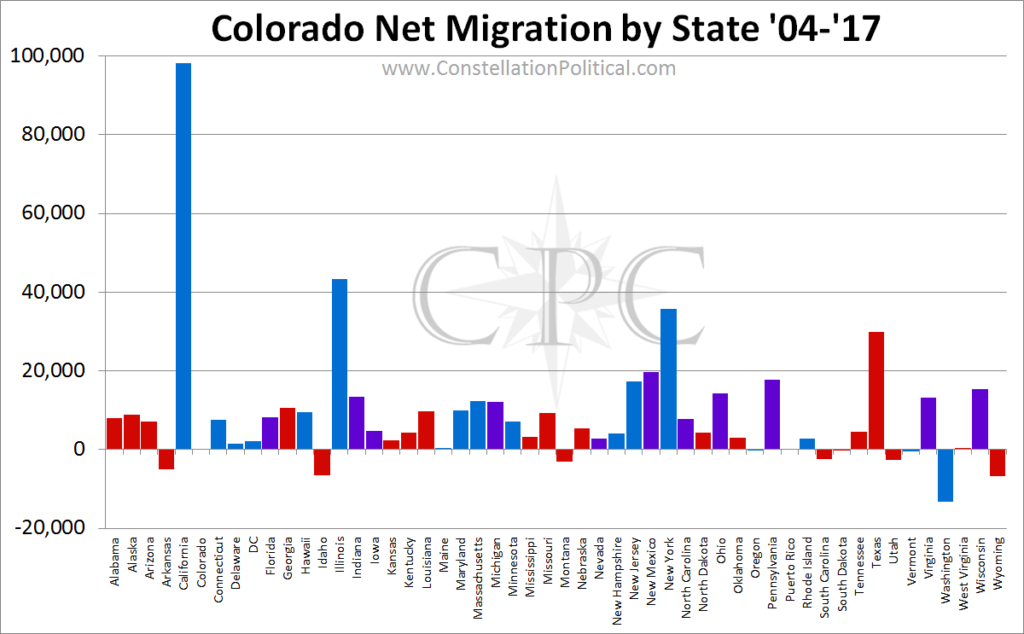
It turns out… very. Graph 1 shows the net number of people who migrated to/from Colorado between 2004 and 2017. The colors indicate whether each state went blue, red, or both in the past four Presidential elections.
For those Coloradans wondering why our legislature seems dead set on giving away our Electoral votes to California, New York and Illinois now you can see why. Because that’s who lives here now!
Over the course of the 13 years in question a net 456,852 people have moved to Colorado. Of that group 98,090 from California, 43,282 from Illinois and 35,712 from New York. Those three states account for 38.8% of all Colorado’s migration.
On the flip side, it looks as though Republicans are putting their money where their mouths are and leaving the state. The majority of the states for which we are a net exporter of people are red states. And, anecdotally, they’re all states I myself have considered fleeing to.
Well… except Arkansas. Really guys?
Colorado Migration & Registration
However, it isn’t all new people moving into the state. During this time period when 456,852 new people moved into Colorado, voter registration grew by 856,246. The folks moving into the state could have accounted for, at most, 53.4% of the newly registered voters. And as my, now famous, registration graph shows while registration in CO is way up, the edge Republicans once had has vanished.
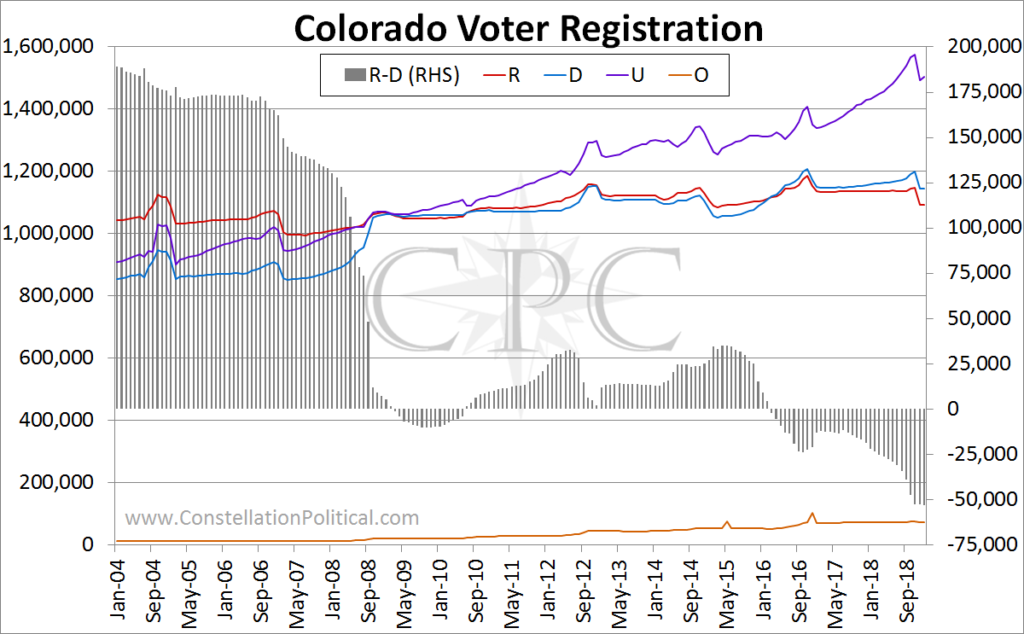
During this time period with registration up 856,246 the Republican registration advantage went from +183,869 to -13,634. That’s a 197,503 drop.
Colorado Migration Over Time
But it’s not all bad news. Net migration into Colorado surged between 2010 and 2015 and it now appears to be tapering off.
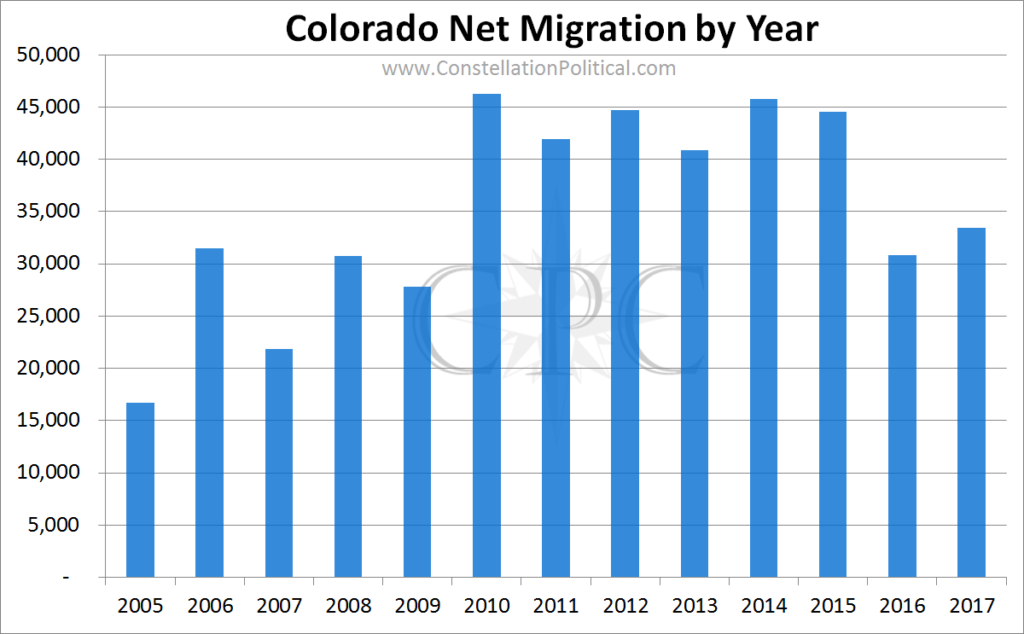
As you can see in Graph 3, our annual net migration in the prior two years has dropped back by about 15,000 and is now a bit closer to where it was before 2010.
Frivolous Complexity
Despite the slowdown in Colorado migration the damage appears to be done. But with California, Illinois and New York accounting for, at most, 20.7% of Colorado’s voter registration growth in this time period I got to wondering… can we definitively pin this on them?
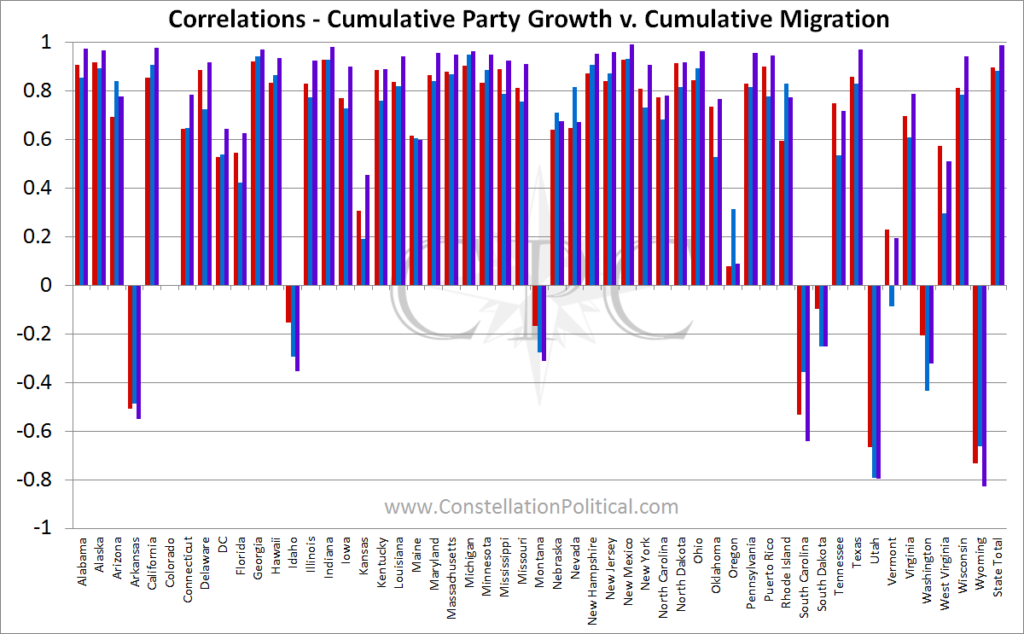
For those who were waiting for this to get needlessly complicated take a gander at Graph 4. If, like most people, you’ve lost interest by now I’ll just answer the question. What California and New York have really given us are Unaffiliated voters. But, as we’ve previously discussed, these new Unaffiliated voters are breaking left and handing victories to Colorado Democrats. So yes, it’s California’s fault.
Graph 4 shows the correlations between each states cumulative Colorado migration and the growth in partisan registrations.
Let’s use the infamous California as an example.
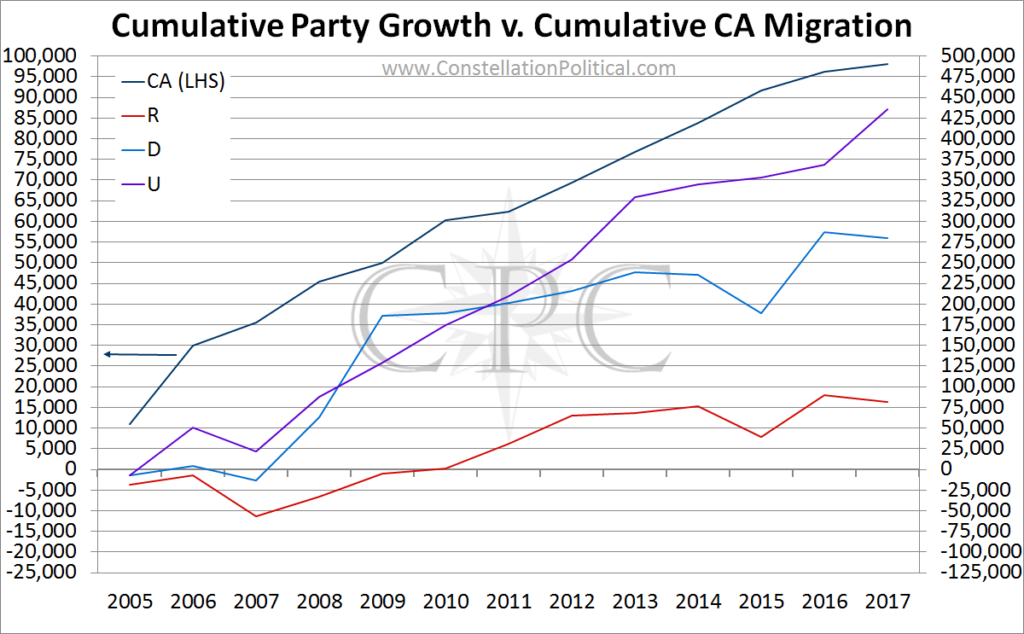
As you can see in Graph 5, the slope of the line showing Colorado migration from California is most similar to the line showing Unaffiliated registration growth. This is why Graph 4 shows California migration as being most correlated with Unaffiliated registration.
This shorthand test can be used to get a sense for who each state is sending Colorado. Graph 4 shows that it’s mostly Unaffiliated voters. And this is what we would expect because that is where we have seen the most growth.
Red Flight
The states where Colorado has sent more people than we received show negative correlations so these have to be interpreted a bit differently. Let’s use Wyoming as an example.
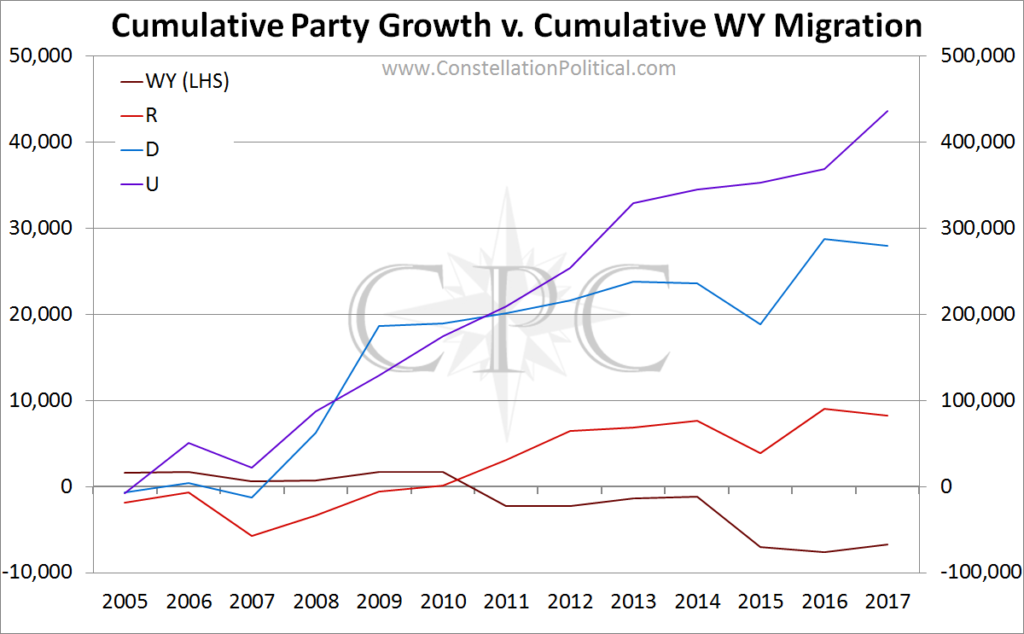
Graph 4 makes it look like most of the people leaving Colorado for Wyoming are Unaffiliated voters. That intuitively seems wrong and Graph 6 shows why. Graph 4 is saying that the relationship between growth in Unaffiliated registration in Colorado and people moving to Wyoming is strongly negative. Basically, as more Unaffiliated voters move to Colorado more people are leaving for Wyoming.
Now, look at the growth in Republican registration from Graph 6. Colorado is still growing so Republican registration is up. However, as the number of people moving to Wyoming grew, the pace of Republican registration slowed. Therefore, this broke the correlation between Republican registration and migration to Wyoming.
So, when considering states with negative correlations it is the shortest column in each group that represents who is leaving Colorado for that state.
The first graph shows the State’s that folks are moving to from Colorado at least.
I’d like to know the top 5 states CO conservatives are moving to. I’ve lived here 21 years and disgusted with the radical liberal cesspool the state is turning into, and it’s only going to get worse. CO has been Californicated.
oh and , yes we are also moving, since fh gave away our votes
I have lived in Colorado since I was 17, I’m now 58, I have ALWAYS been UA .
Because both party’s are corrupt !!!!!!!!!!!!
http://www.constellationpolitical.com/blog/party-switchers-leave-major-parties/
How about the numbers that have left both parties that were staunch to whichever one they were. Both my parents came from Ca and NY but both hard republicans now un affiliated, as am I. So show us the numbers now unaffiliated to any party