 Colorado Republican’s Best Candidates
Summary
Colorado Republican’s electoral results have outperformed the decline in our registration.
This has been made possible by certain candidates strongly overperforming even in bad years.
In recent history the best GOP candidates have been Suthers, Bush, Coffman, and Ganahl.
In recent history the worst GOP candidates have been Beauprez, Schaffer, Stapleton, and Trump.
The Numbers
More false claims on social media and my recent analysis on Colorado’s split ticket performance prompted a question – who are Colorado Republican’s best candidates?
It feels like Colorado Republicans haven’t had a good cycle in an age. And that things in Colorado are only slipping further and further away from us. Looking at our steadily declining fortunes in voter registration only exacerbates this feeling.
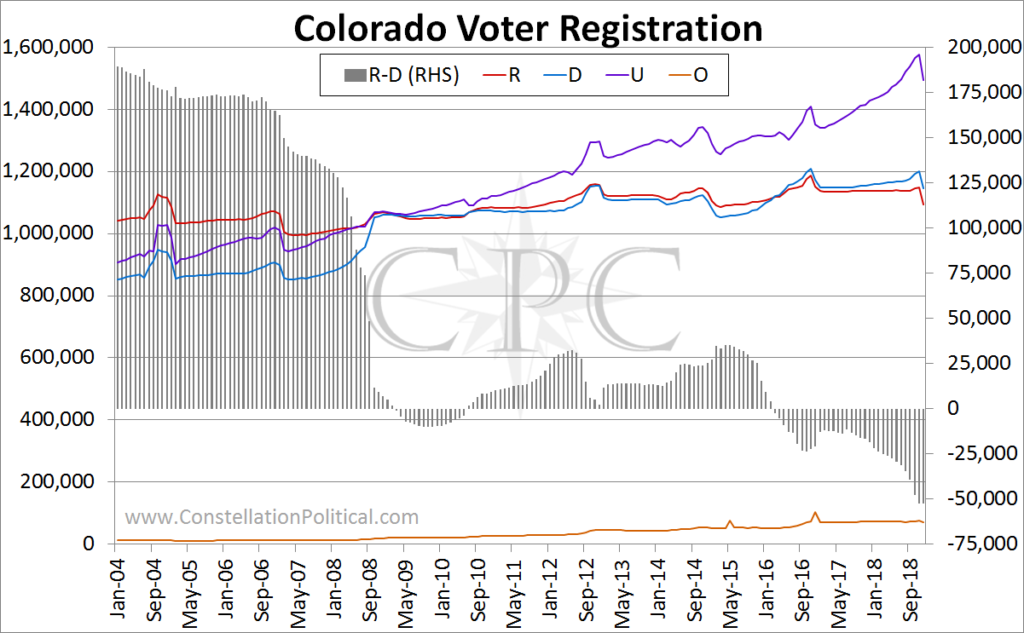
Cycle Performance
Despite, a couple of tough cycles for Colorado Republicans our statewide performance has remained much more stable than I’d realized.
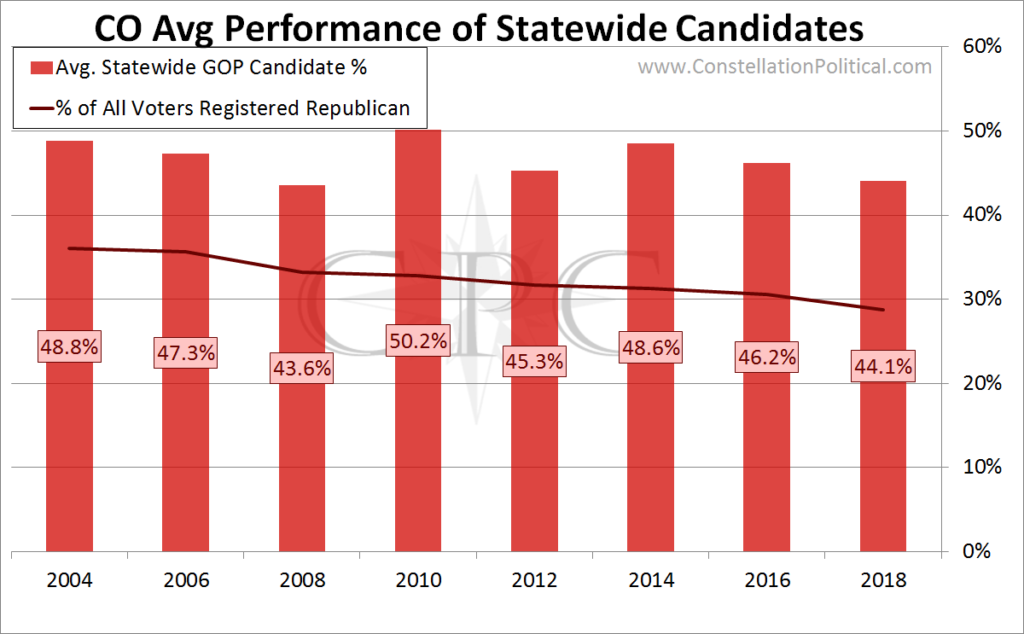
Graph 2 should be pretty self explanatory. The solid line shows the percentage of all registered voters that were registered Republican in November of each of those years. And the bars show the average percentage of the vote received by all statewide Republican candidates.
The registration line shows a clear downward trend since 2004. However, our average electoral performance has been much more stable. Here is the same graph with linear trendlines added.
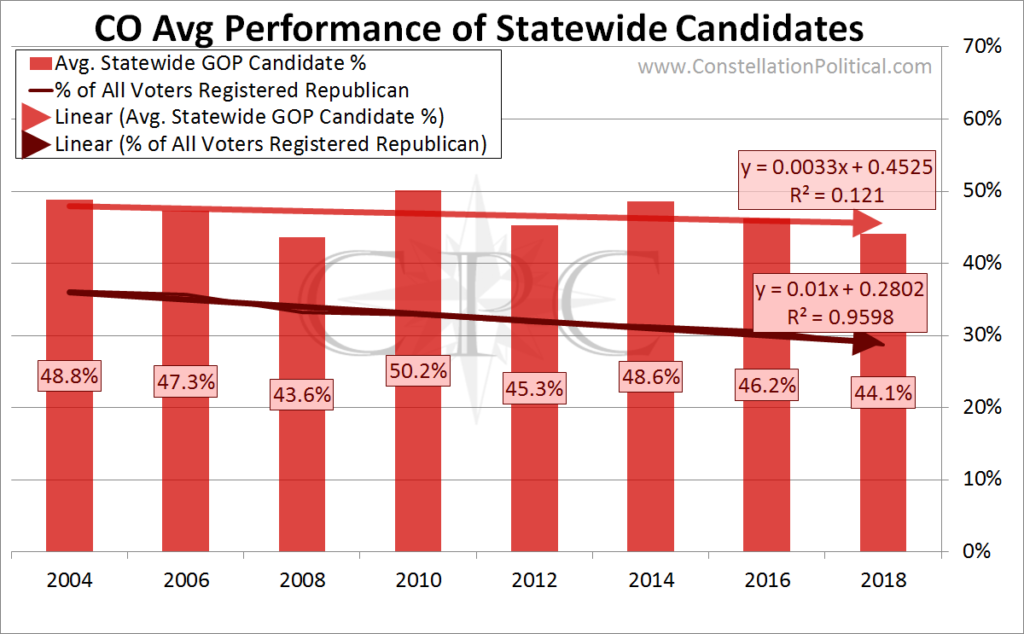
Republican’s representation as a percentage of registered voters has declined by a very consistent 1.1 points every year since 2004. Additionally, that R2 of 0.9598 means this is a very tight linear correlation.
Our average statewide election performance has only declined by 0.3 points per year. However, this trend is not as perfectly linear as our registration deterioration. And you can see that in the graph there are more ups and downs in our election results whereas registration has gone steadily down.
Republican Candidate Performance
The reason our average election performance has outperformed the trend in registration is that some candidates have managed strong results in otherwise poor years.
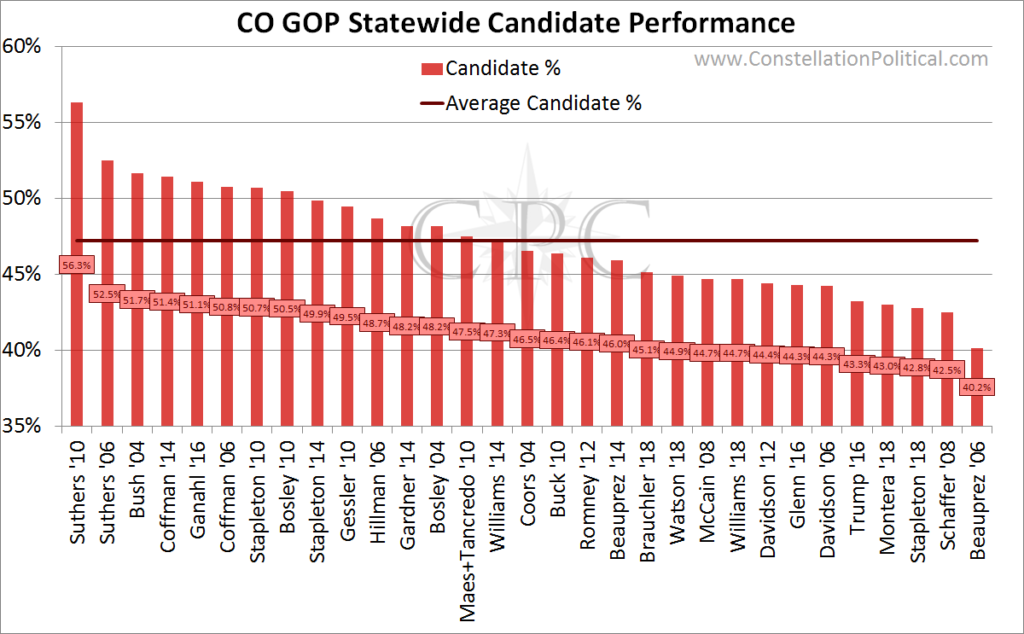
Graph 4 shows the percentage of the vote received by each of our statewide candidates back through 2004. The solid horizontal line is the average percentage received by all those same candidates.
Note that there are candidates who ran in the same cycle yet appear at opposite ends of the range of Republican performance.
Our Best Candidates
It’s easier to see the standouts if we look at their performance relative to the average.
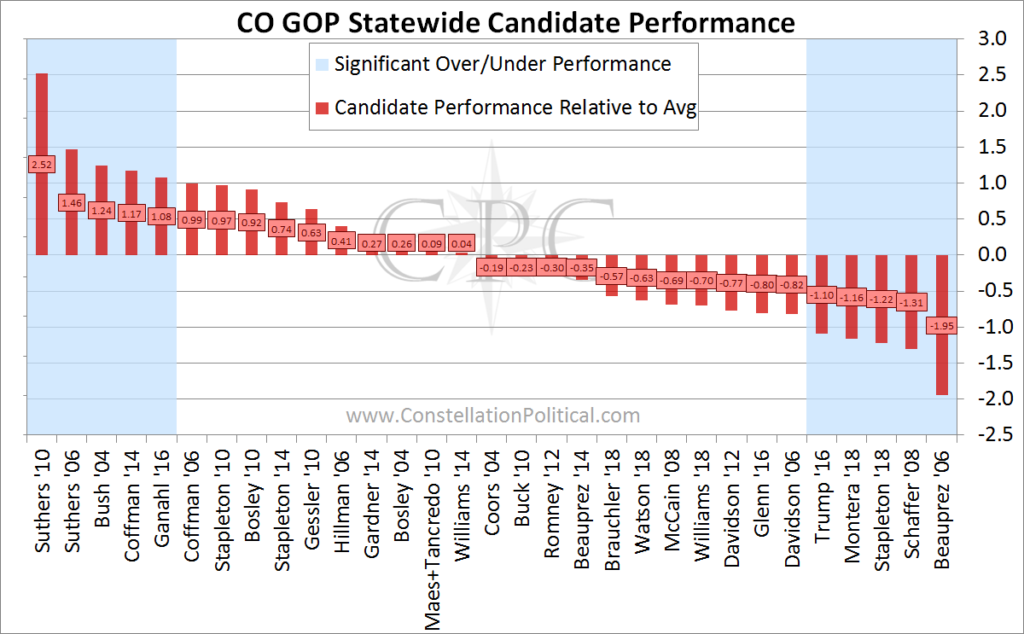
Graph 5 shows how far above or below the average each candidate’s performance was. However, campaigns are messy things and a lot can change between races and cycles. The blue shading denotes an outcome far enough from average that it cannot be attributed to normal statistical variation.
John Suthers is clearly our strongest candidate, holding the top two spots on this ranking.
We don’t even have to look too far back to find a candidate with a definitive overperformance. Heidi Ganahl’s outcome in 2016 ranks fifth during this period.
Identity Interlude
I abhor identity politics as much as the next Republican. However, I’d be remiss if I didn’t point out an interesting aspect of Graph 5. On that list of 31 races there are only two women. And both of them significantly outperformed the Republican average.
Conclusion
Just because Republicans have a bad year doesn’t mean that a strong candidate can’t break through. Our candidate’s that have been able to do this have kept our performance from slipping as quickly as our registration has. If we’re going to find success in the future, it’s the overperforming campaigns that we need to study.